Reports
Overview
Integral provides comprehensive reporting capabilities to help you track your digital asset portfolio, analyze performance, and meet compliance requirements. This guide explains all available reports and when to use them for effective portfolio management and financial reporting.
Closing Positions Reports
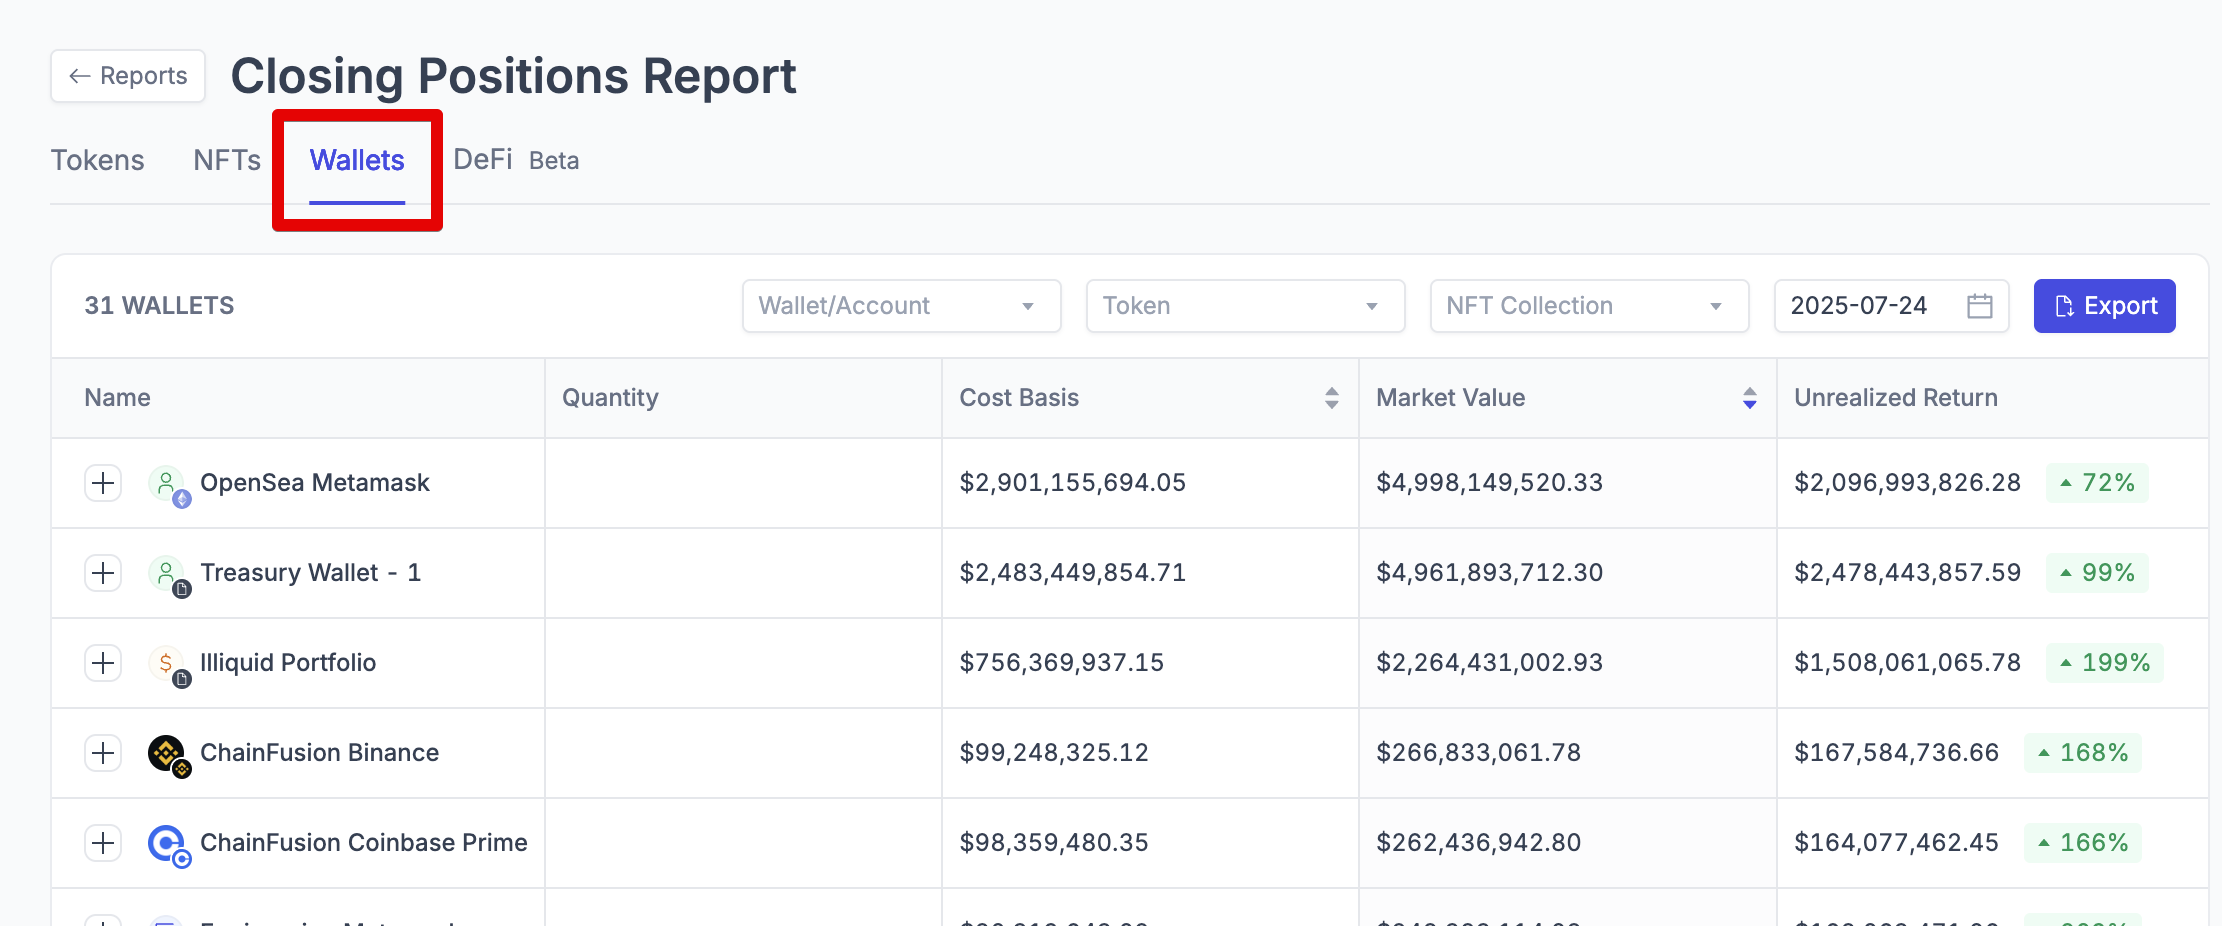
By Wallet
What it shows: Token and NFT balances for each wallet/account at a specific point in time, including cost basis and unrealized returns.
Key information included:
Quantity - Amount of each token or NFT held
Market Value - Current USD value of holdings
Cost Basis - Original purchase price in USD
Unrealized Return - Difference between market value and cost basis
Market Price - Current price per token (in CSV export only)
Valuation Data - Pricing method, timestamp, and source for NFTs (in CSV export only)
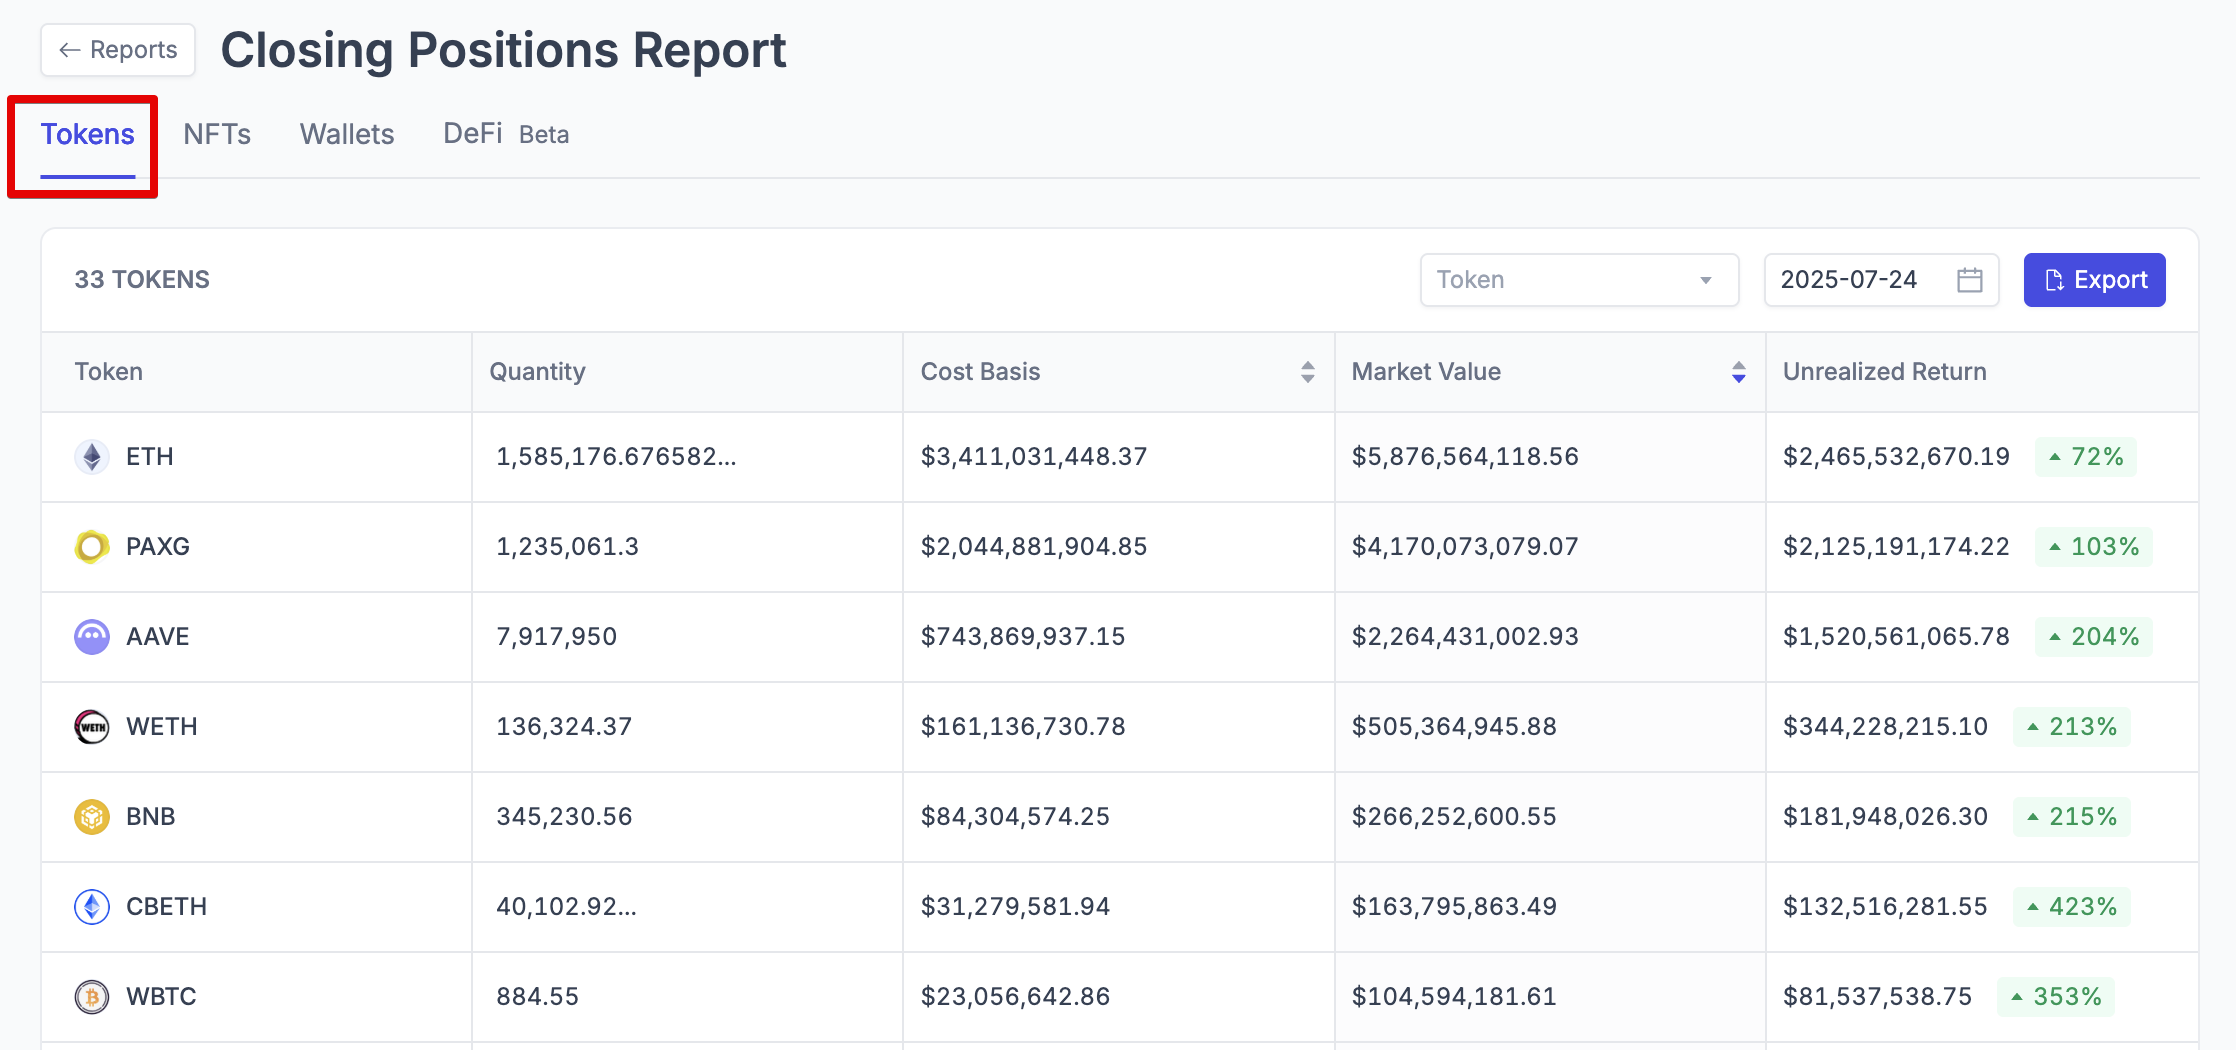
By Token
What it shows: Aggregated token balances across all accounts, providing a consolidated view of your total holdings by asset.
Key information included:
Total Quantity - Combined holdings across all wallets
Aggregated Market Value - Total USD value for each asset
Combined Cost Basis - Total cost basis across all positions
Overall Unrealized Returns - Entity-level gains/losses by asset
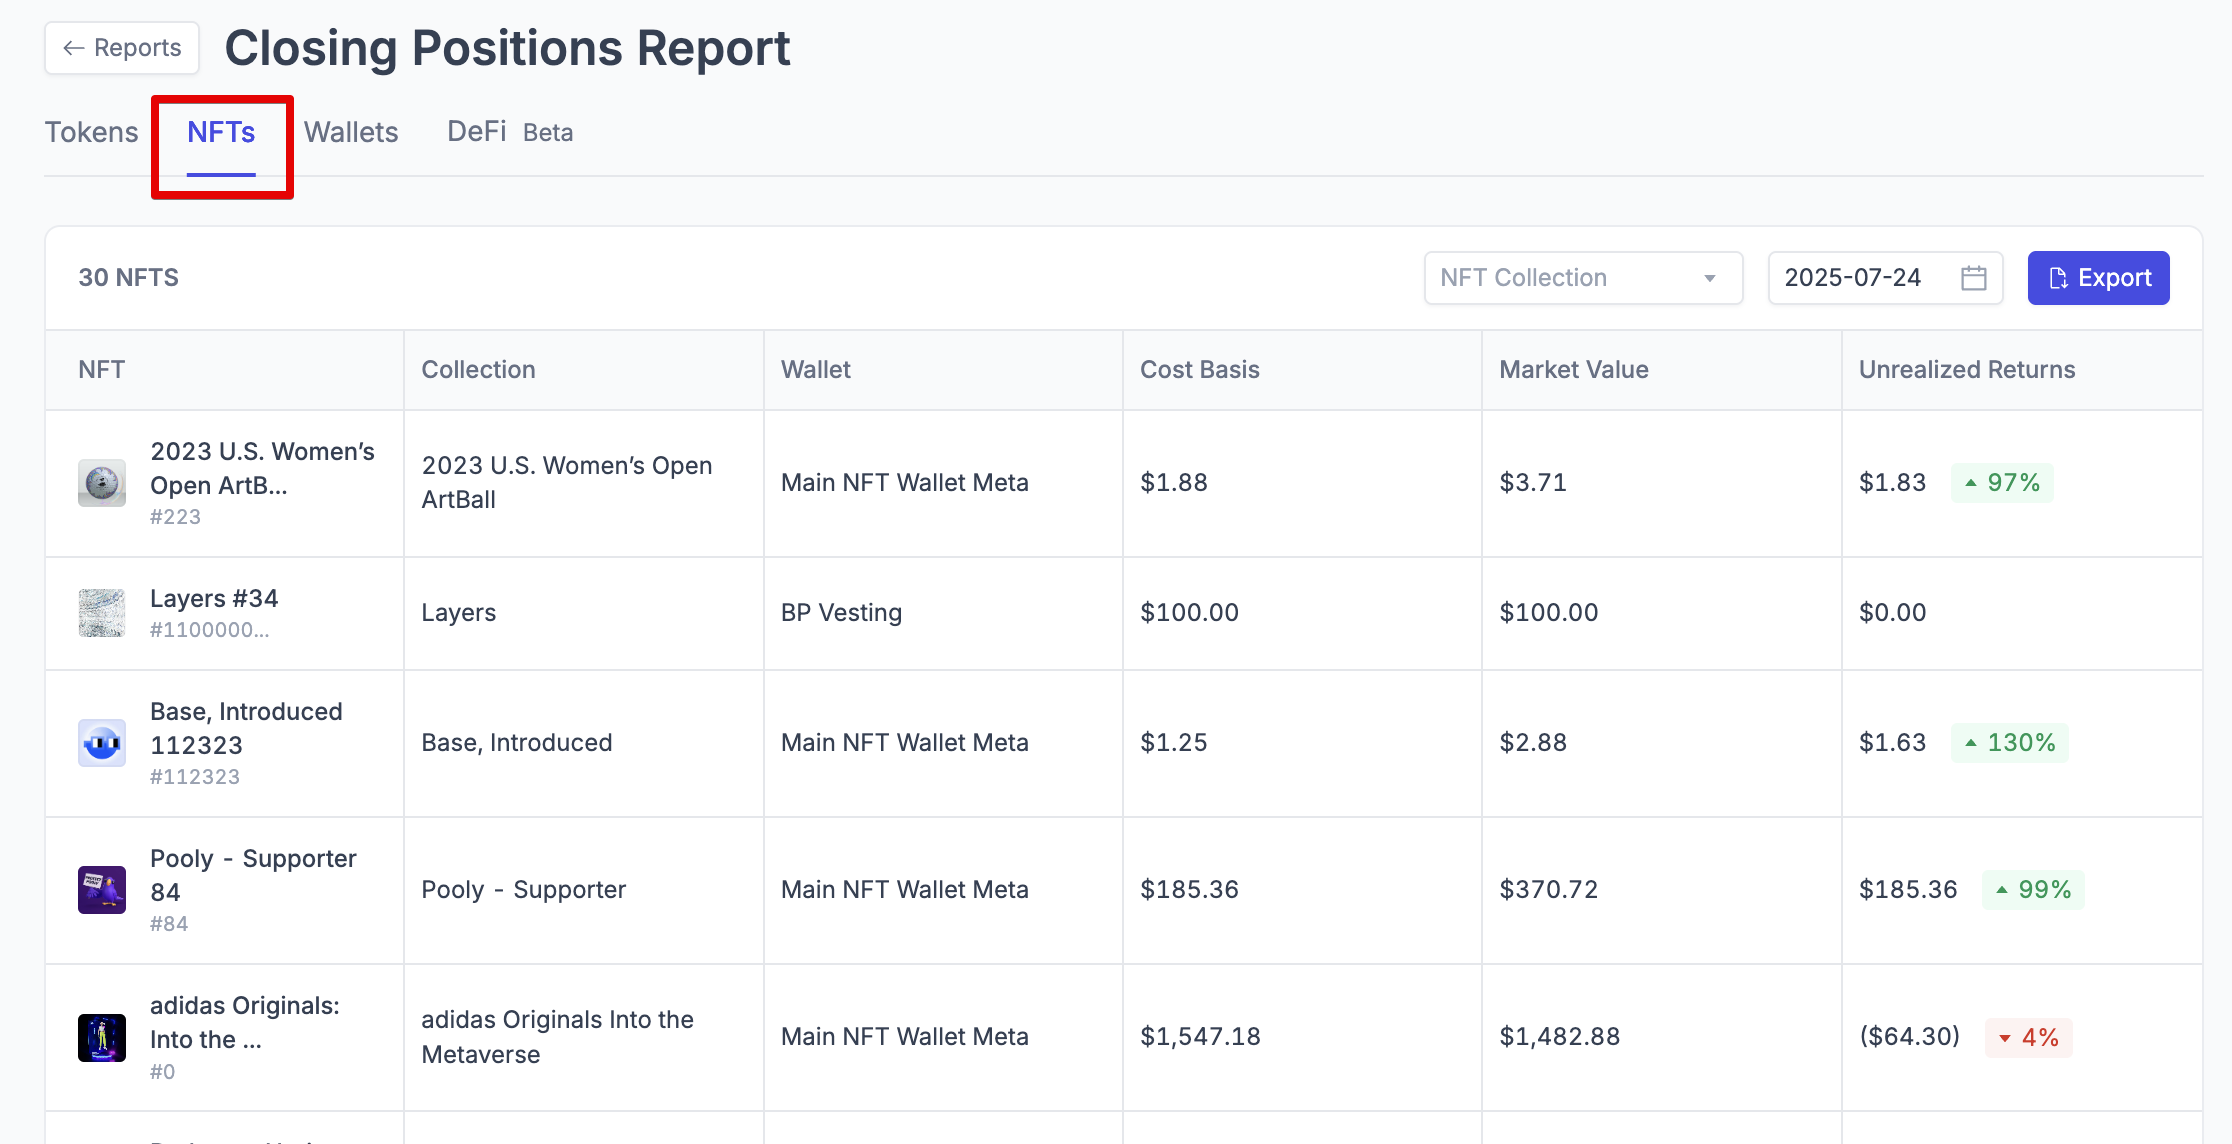
NFT Closing Positions Report
What it shows: NFT collection balances by account, including collection-level valuation and metadata.
Key information included:
Collection Name - NFT collection identifier
Count - Number of NFTs held in each collection (in CSV export only)
Market Value - Total USD value of NFT holdings
Cost Basis - Original acquisition cost
Account Information - Which wallets hold each collection
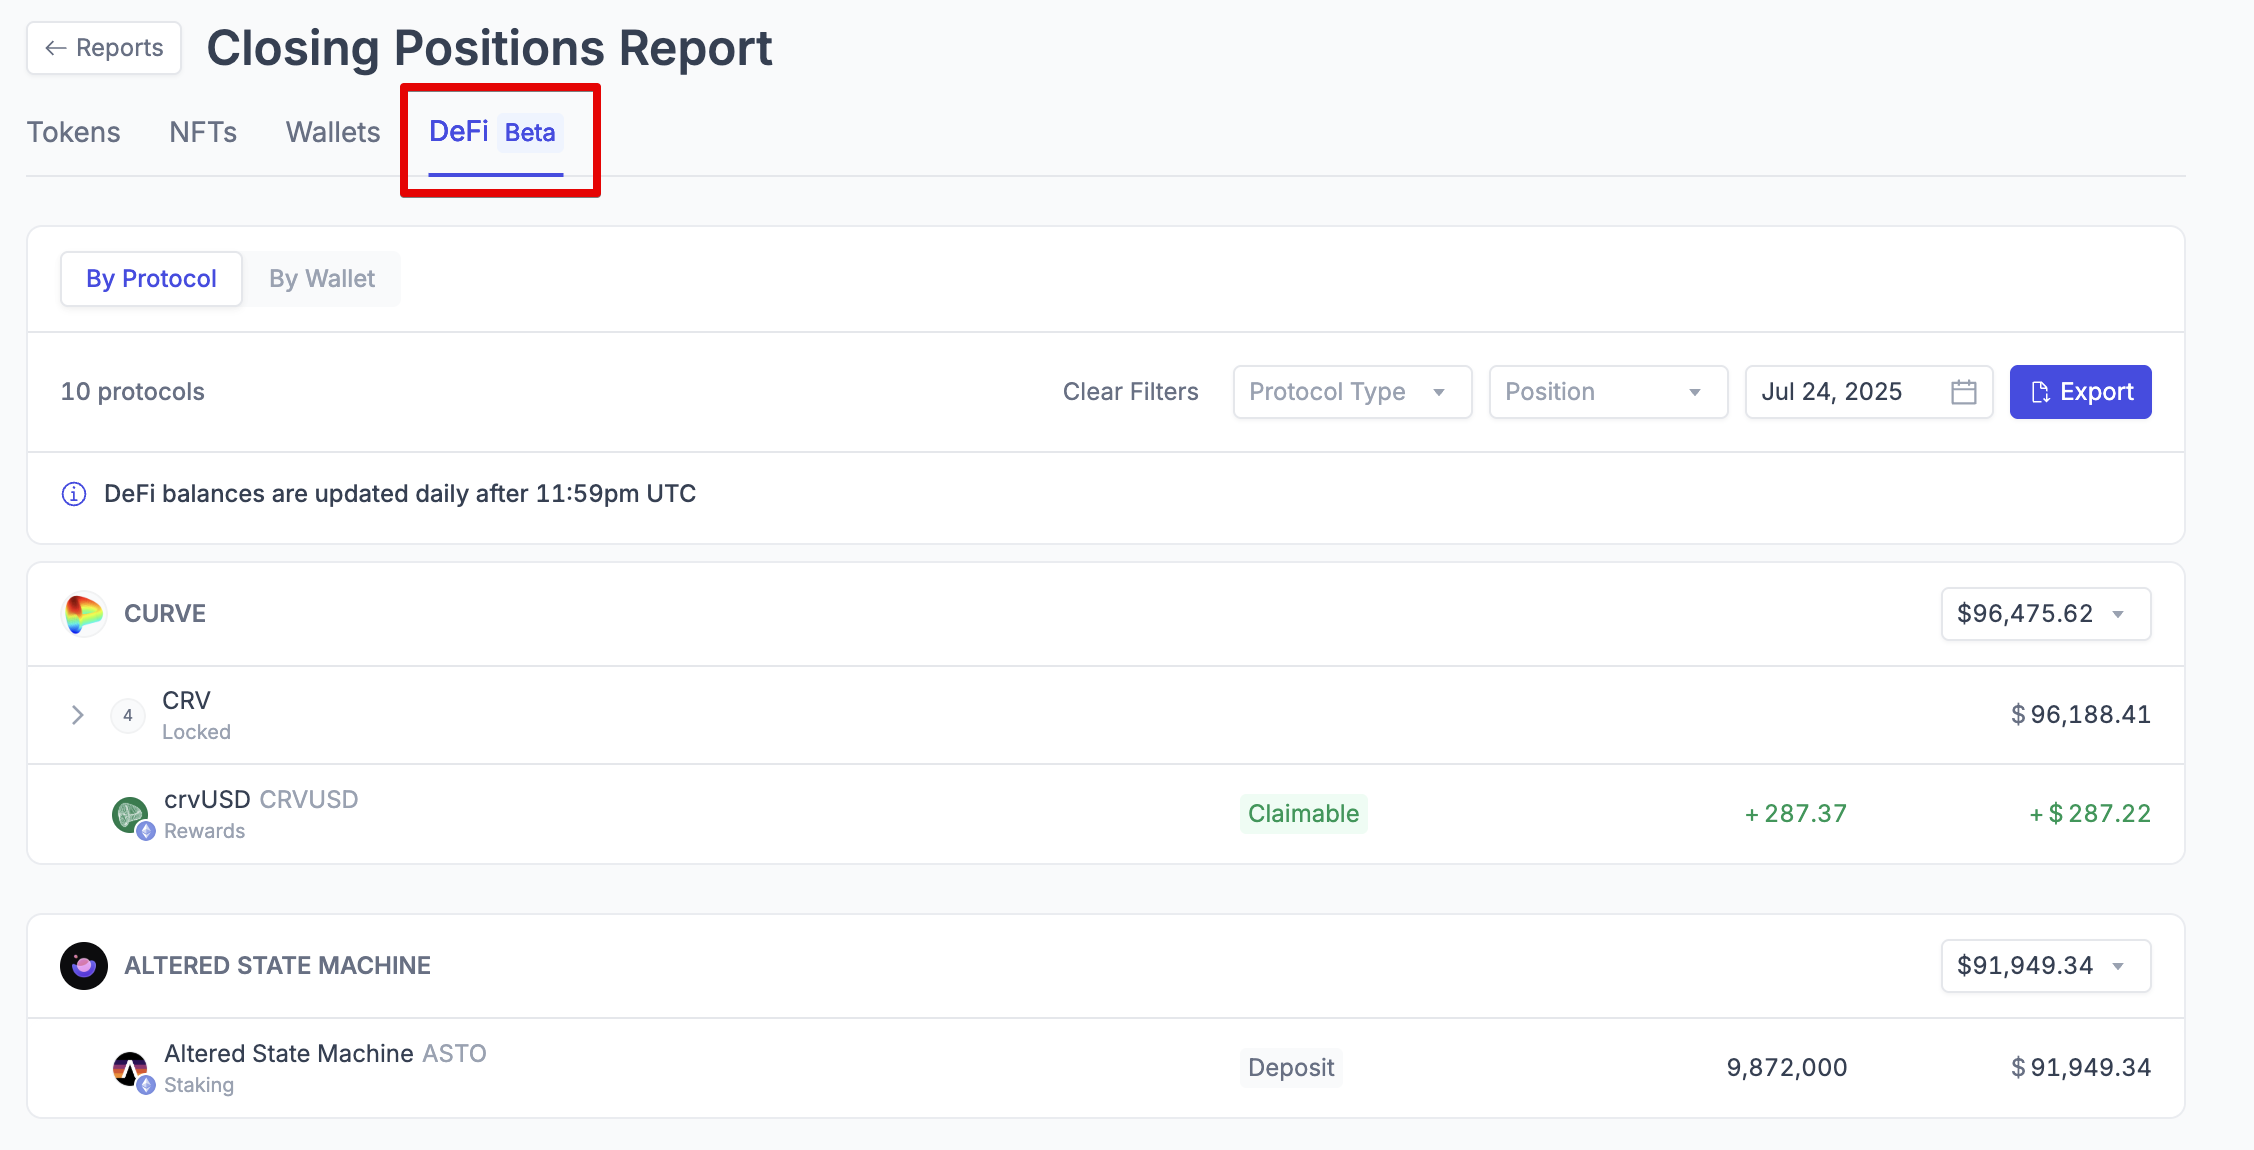
DeFi Closing Positions Report
What it shows: Positions held across decentralized finance protocols, including staking, lending, and liquidity positions.
Key information included:
Protocol Positions - Holdings in various DeFi platforms
Position Types - Staking, lending, liquidity provision, etc.
Current Values - USD value of DeFi positions
Rewards Information - Earnings from DeFi activities
Financial Analysis Reports
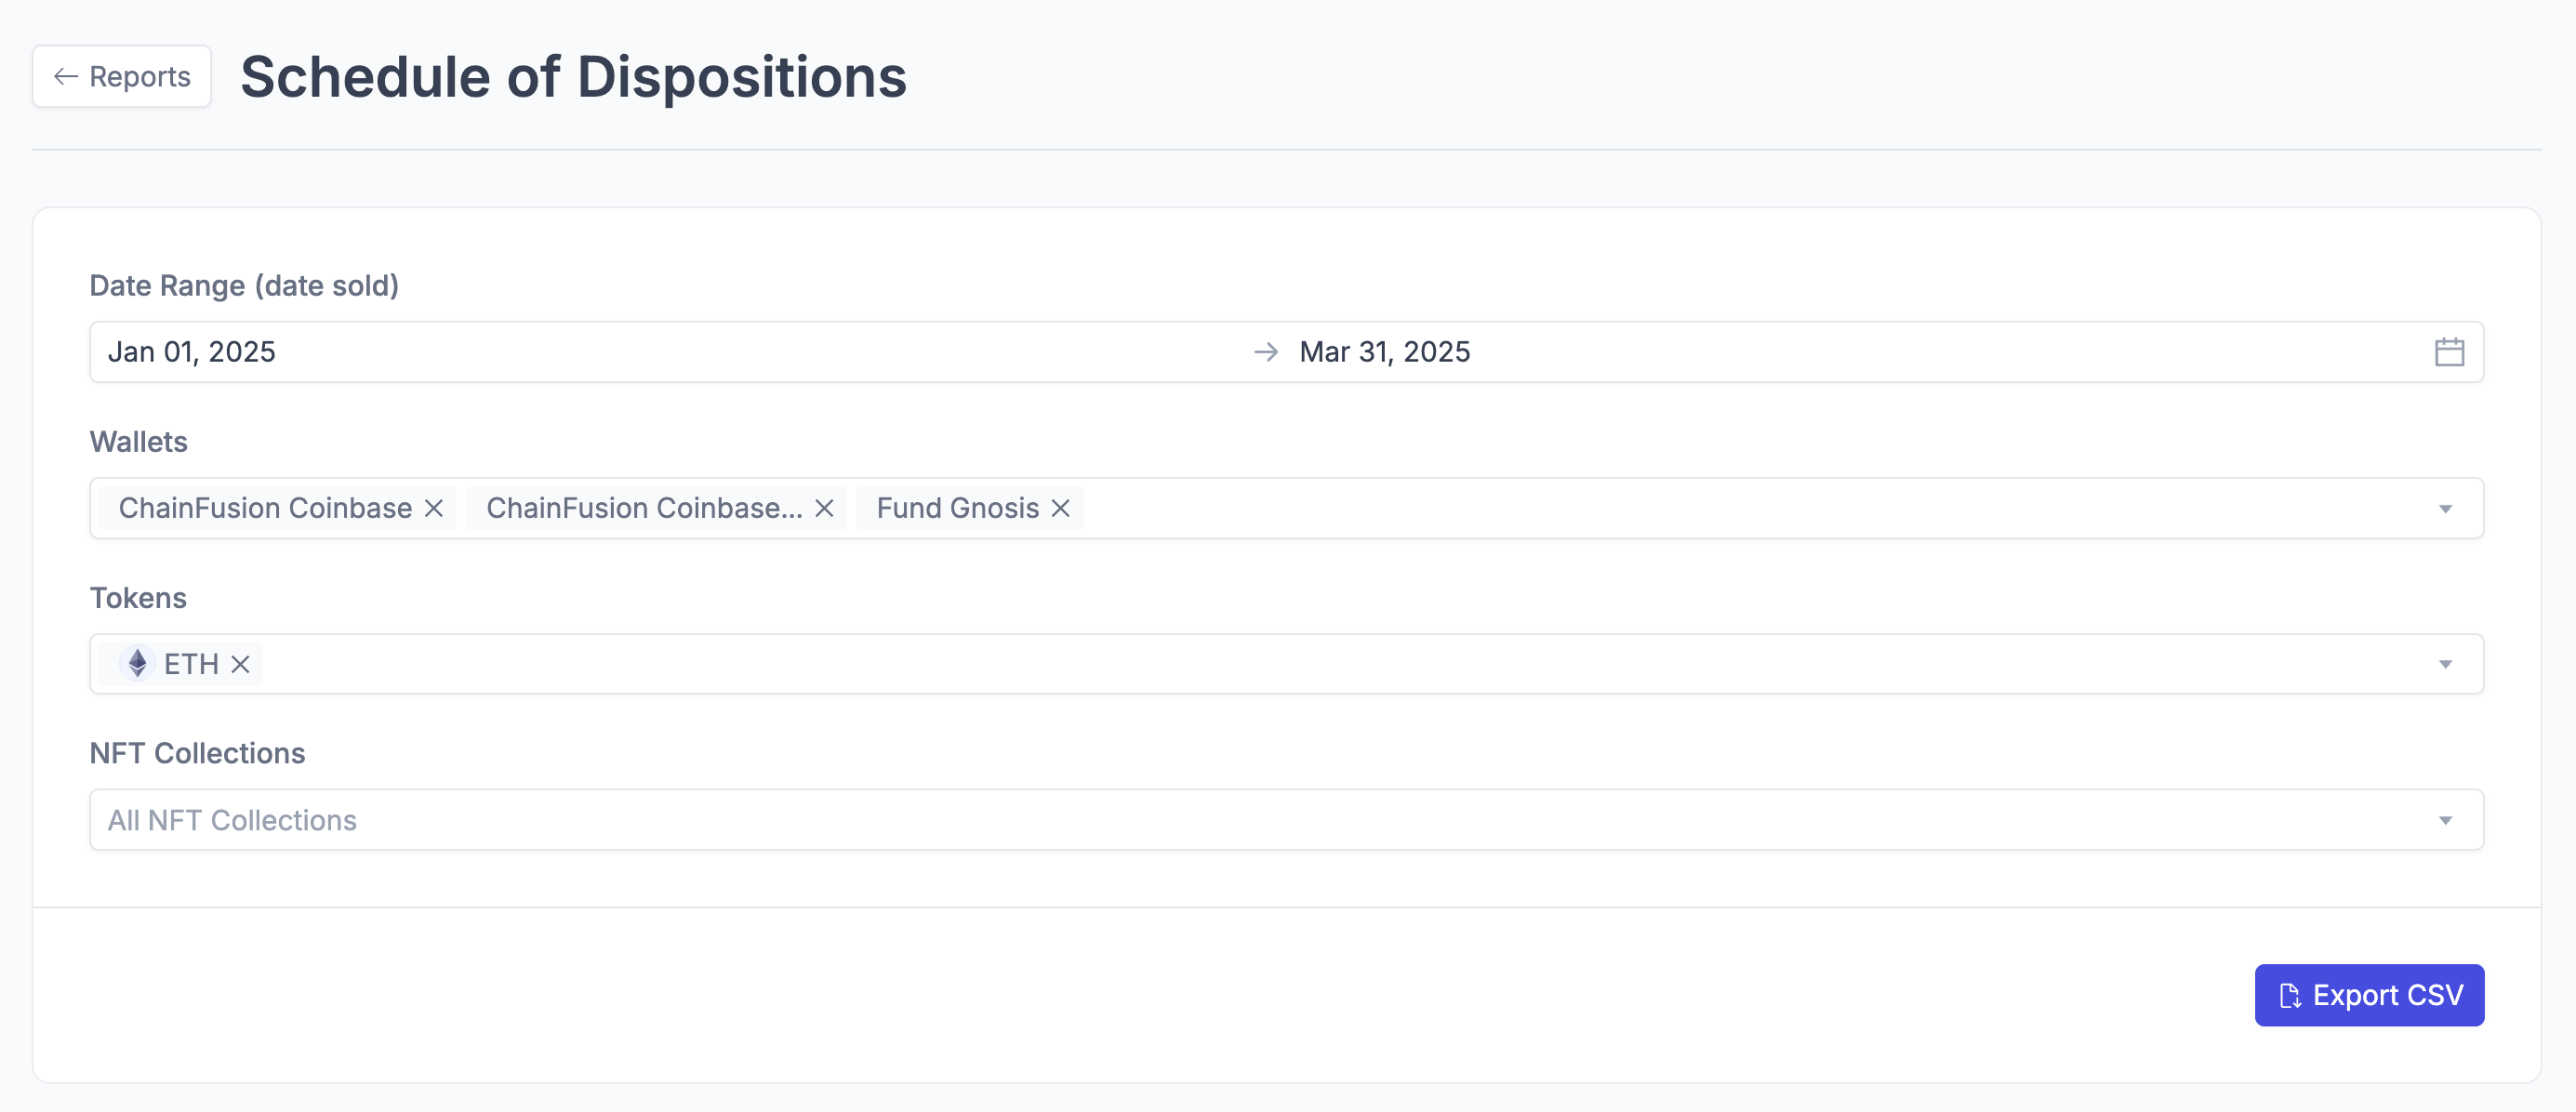
Schedule of Dispositions
What it shows: Detailed record of all asset sales and dispositions with realized gains and losses, using the accounts cost basis method.
Key information included:
Volume - Amount of asset sold
Date Acquired - When the asset was originally purchased
Date Sold - When the asset was disposed of
Proceeds - USD amount received from sale
Cost Basis - Original purchase price
Gain/Loss - Realized profit or loss on the transaction
Account Details - Which wallets were involved in the transaction
Transaction Hashes - Blockchain transaction identifiers
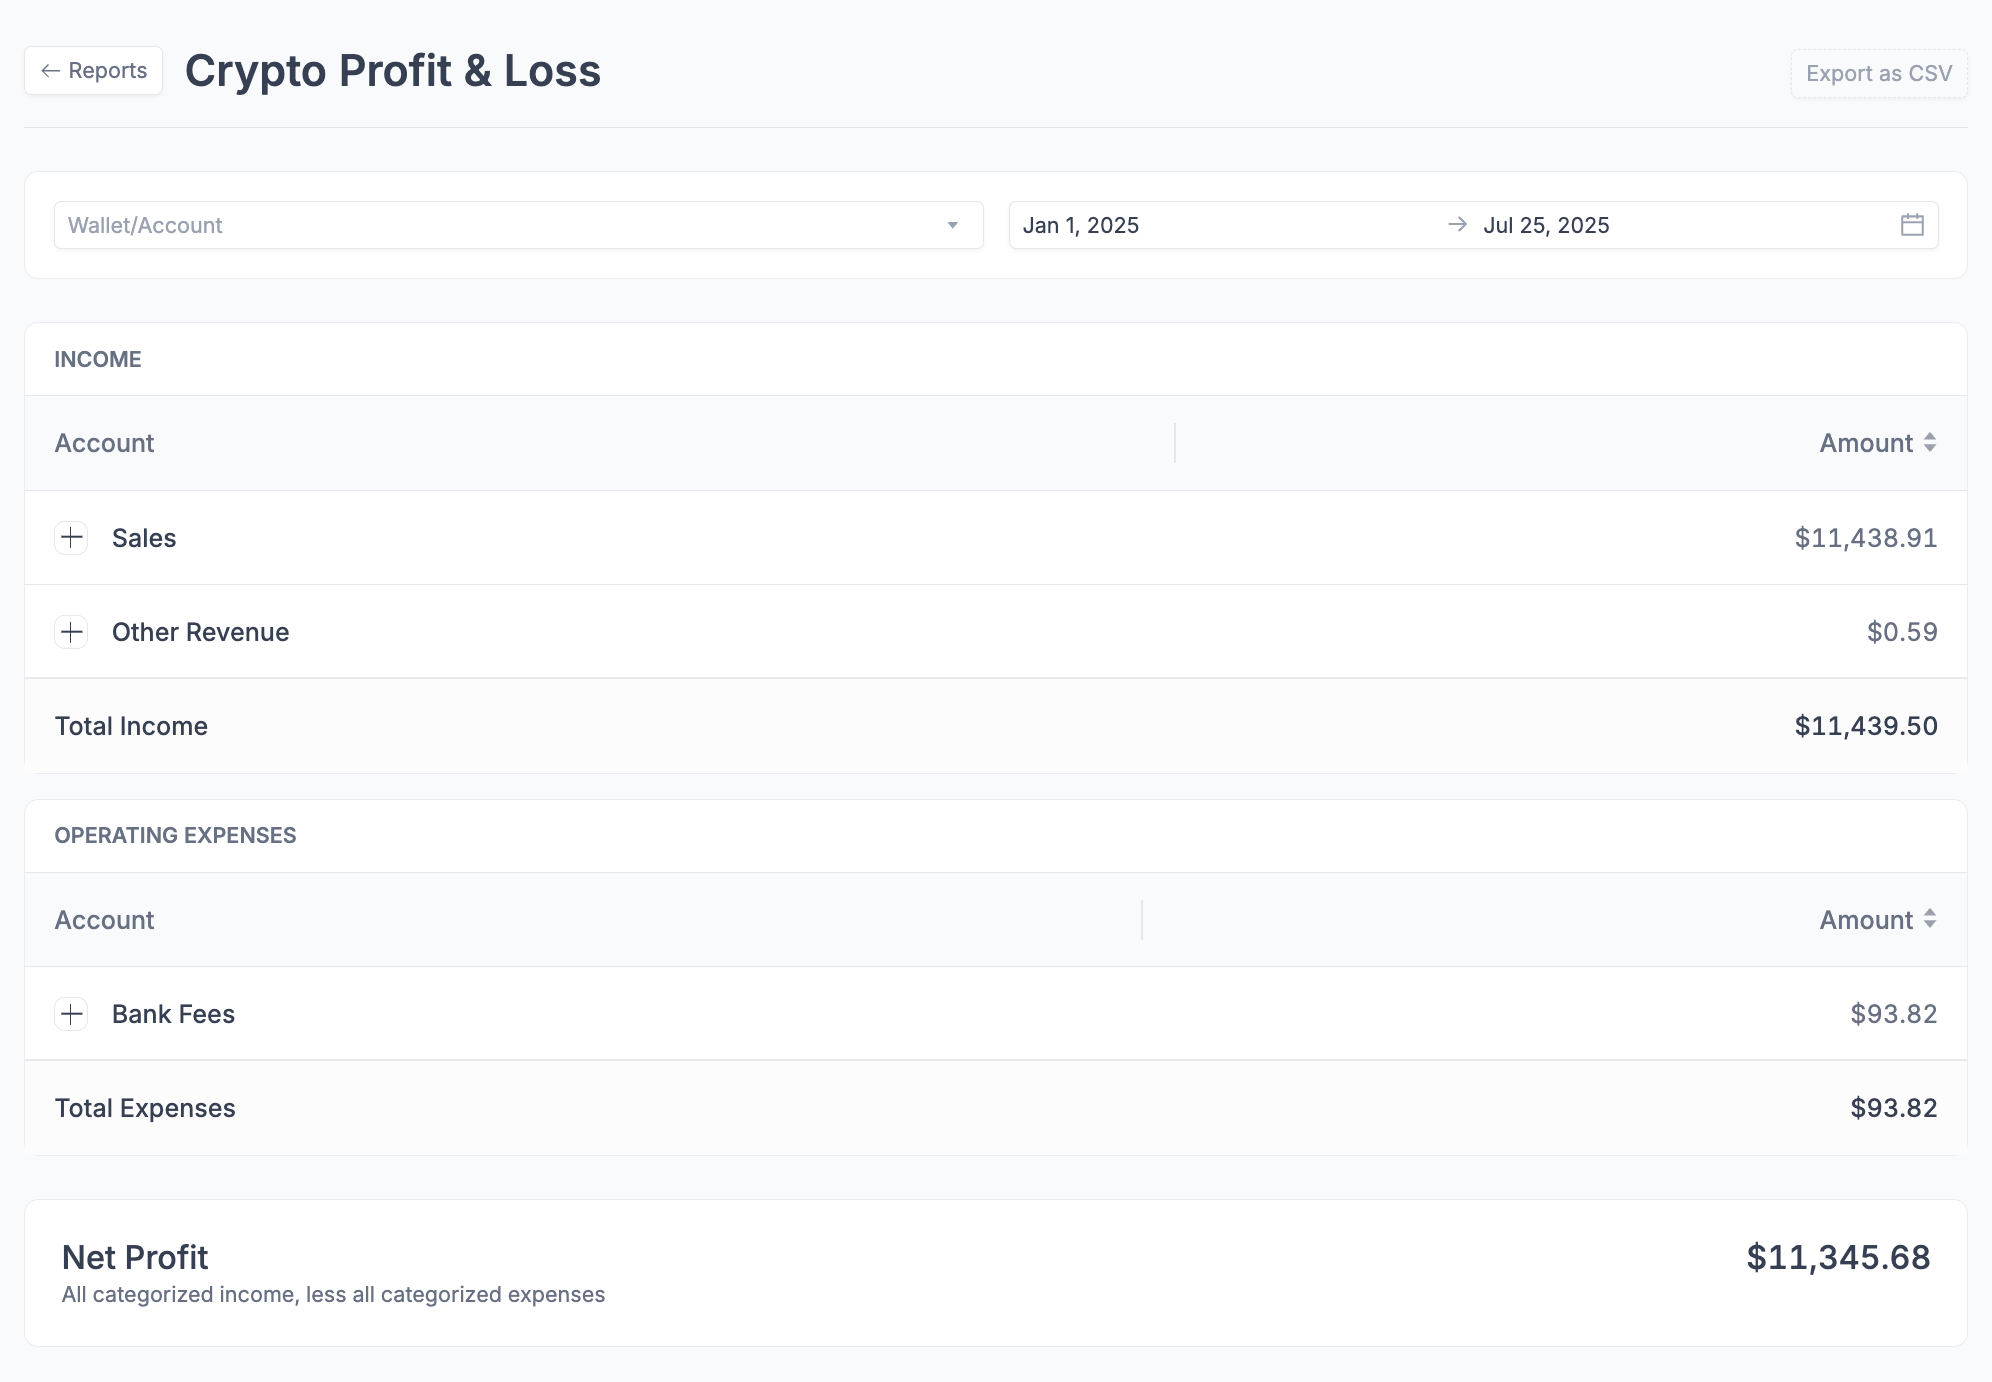
Profit and Loss
What it shows: A summary of categorized income and expenses over a selected period, resulting in net profit or loss from your crypto activity.
Key information included:
Income Categories: Breakdown of all income, such as sales and other revenue
Expense Categories: Breakdown of operating expenses, such as transaction fees
Total Income: Sum of all categorized income for the period
Total Expenses: Sum of all categorized operating expenses
Net Profit: Income minus expenses, showing overall profitability
Date Range: Customizable period for which the report is generated
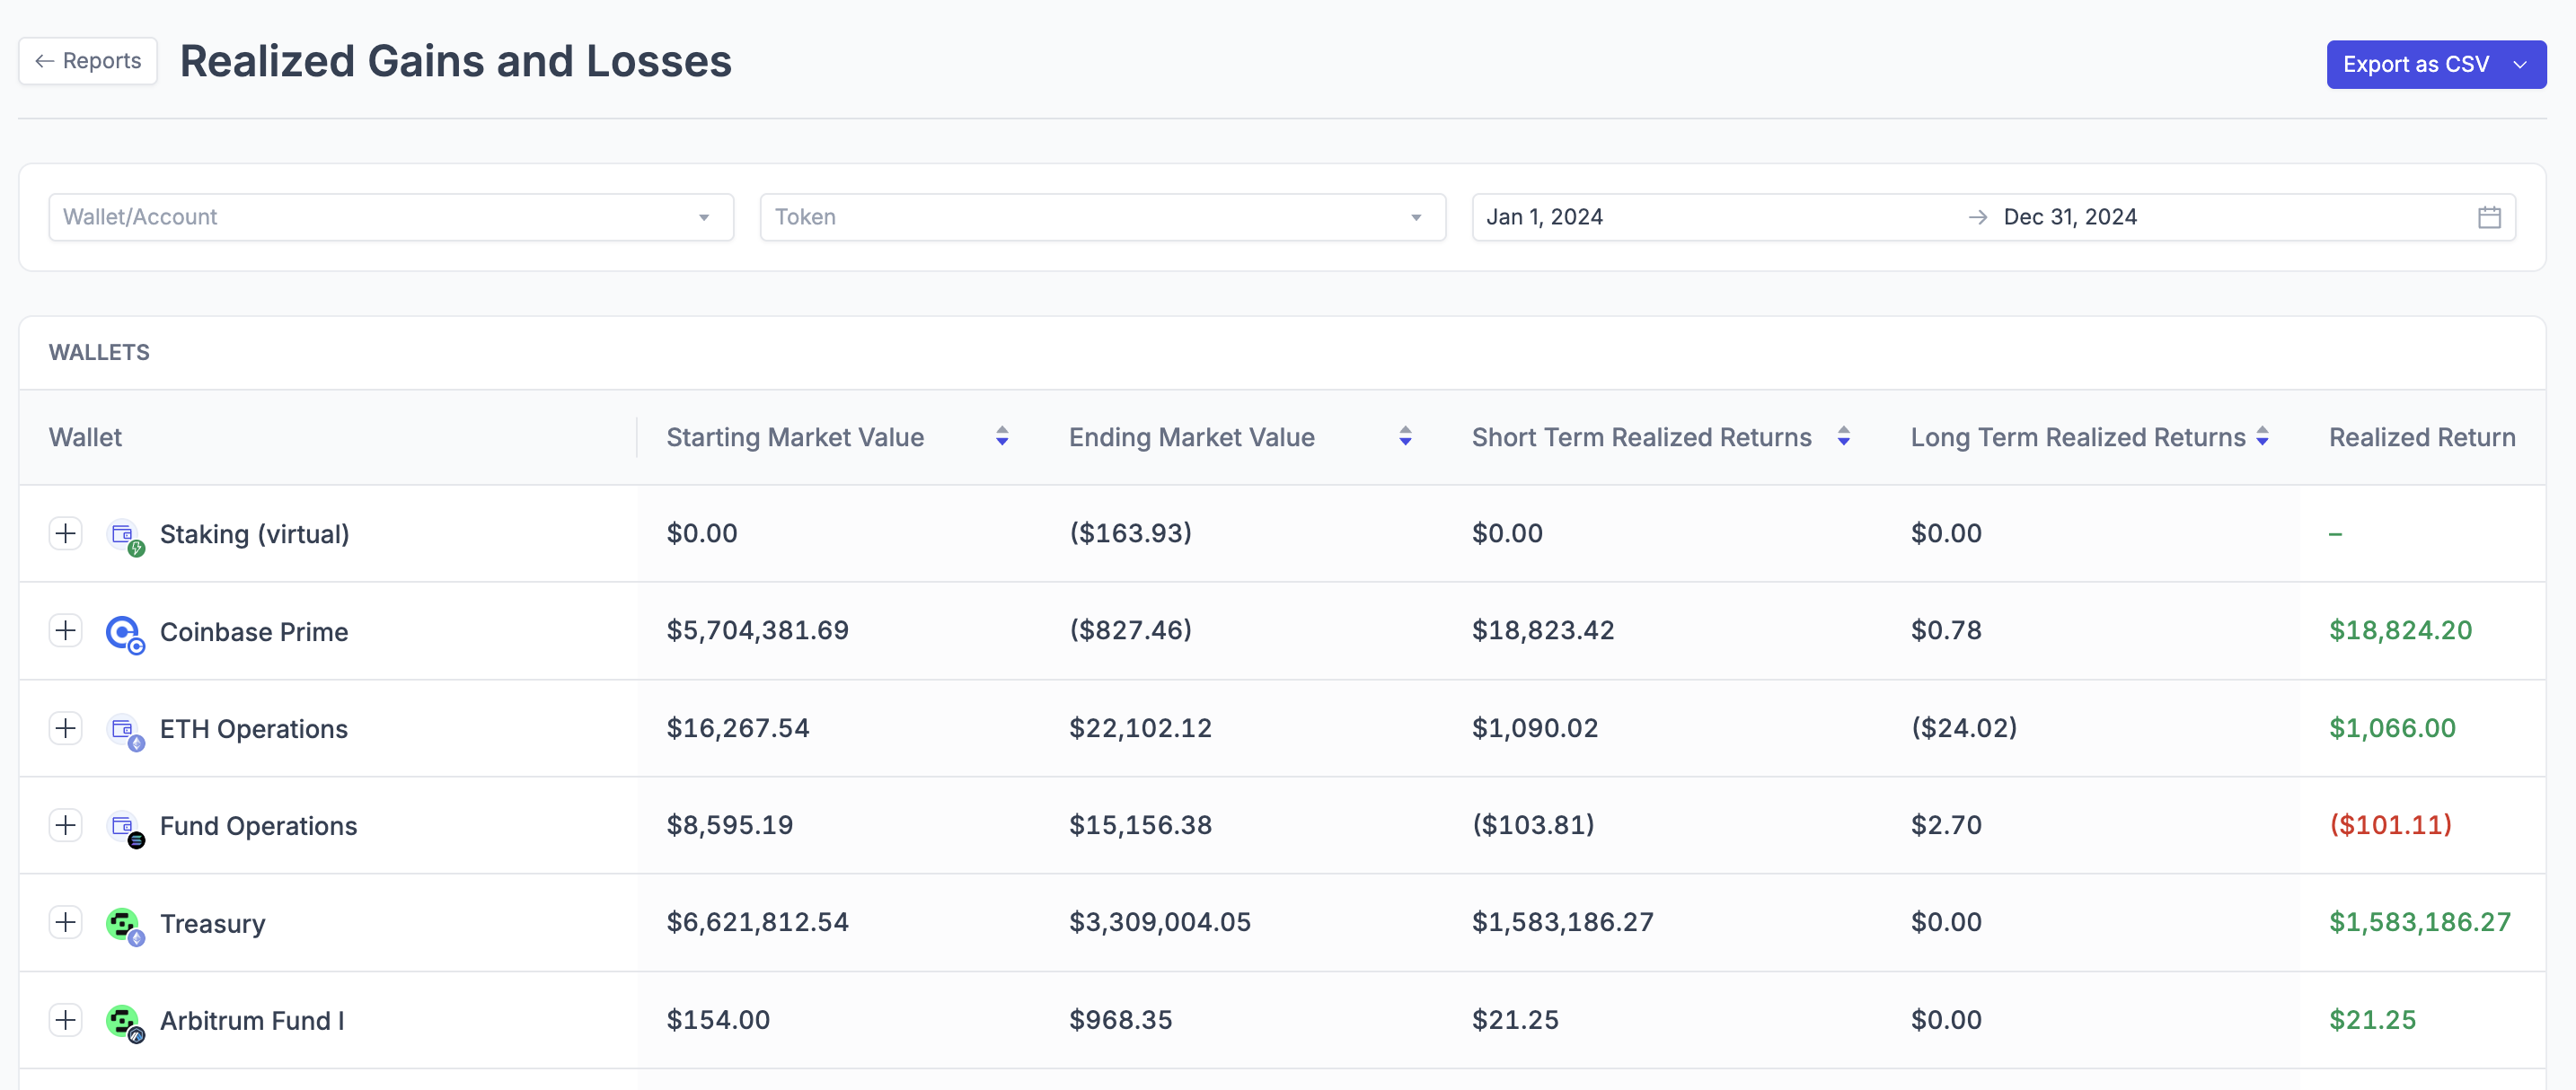
Realized Gain/Loss
What it shows: Summary of realized returns by asset or account over a specified time period, with short-term and long-term classifications.
Key information included:
Starting/Ending Quantities - Position changes over the period
Inflow/Outflow Activity - Purchases and sales during the period
Total Realized Returns - Net gains/losses from dispositions
Short-Term vs Long-Term - Tax classification of gains/losses
Market Value Changes - Fair value movements
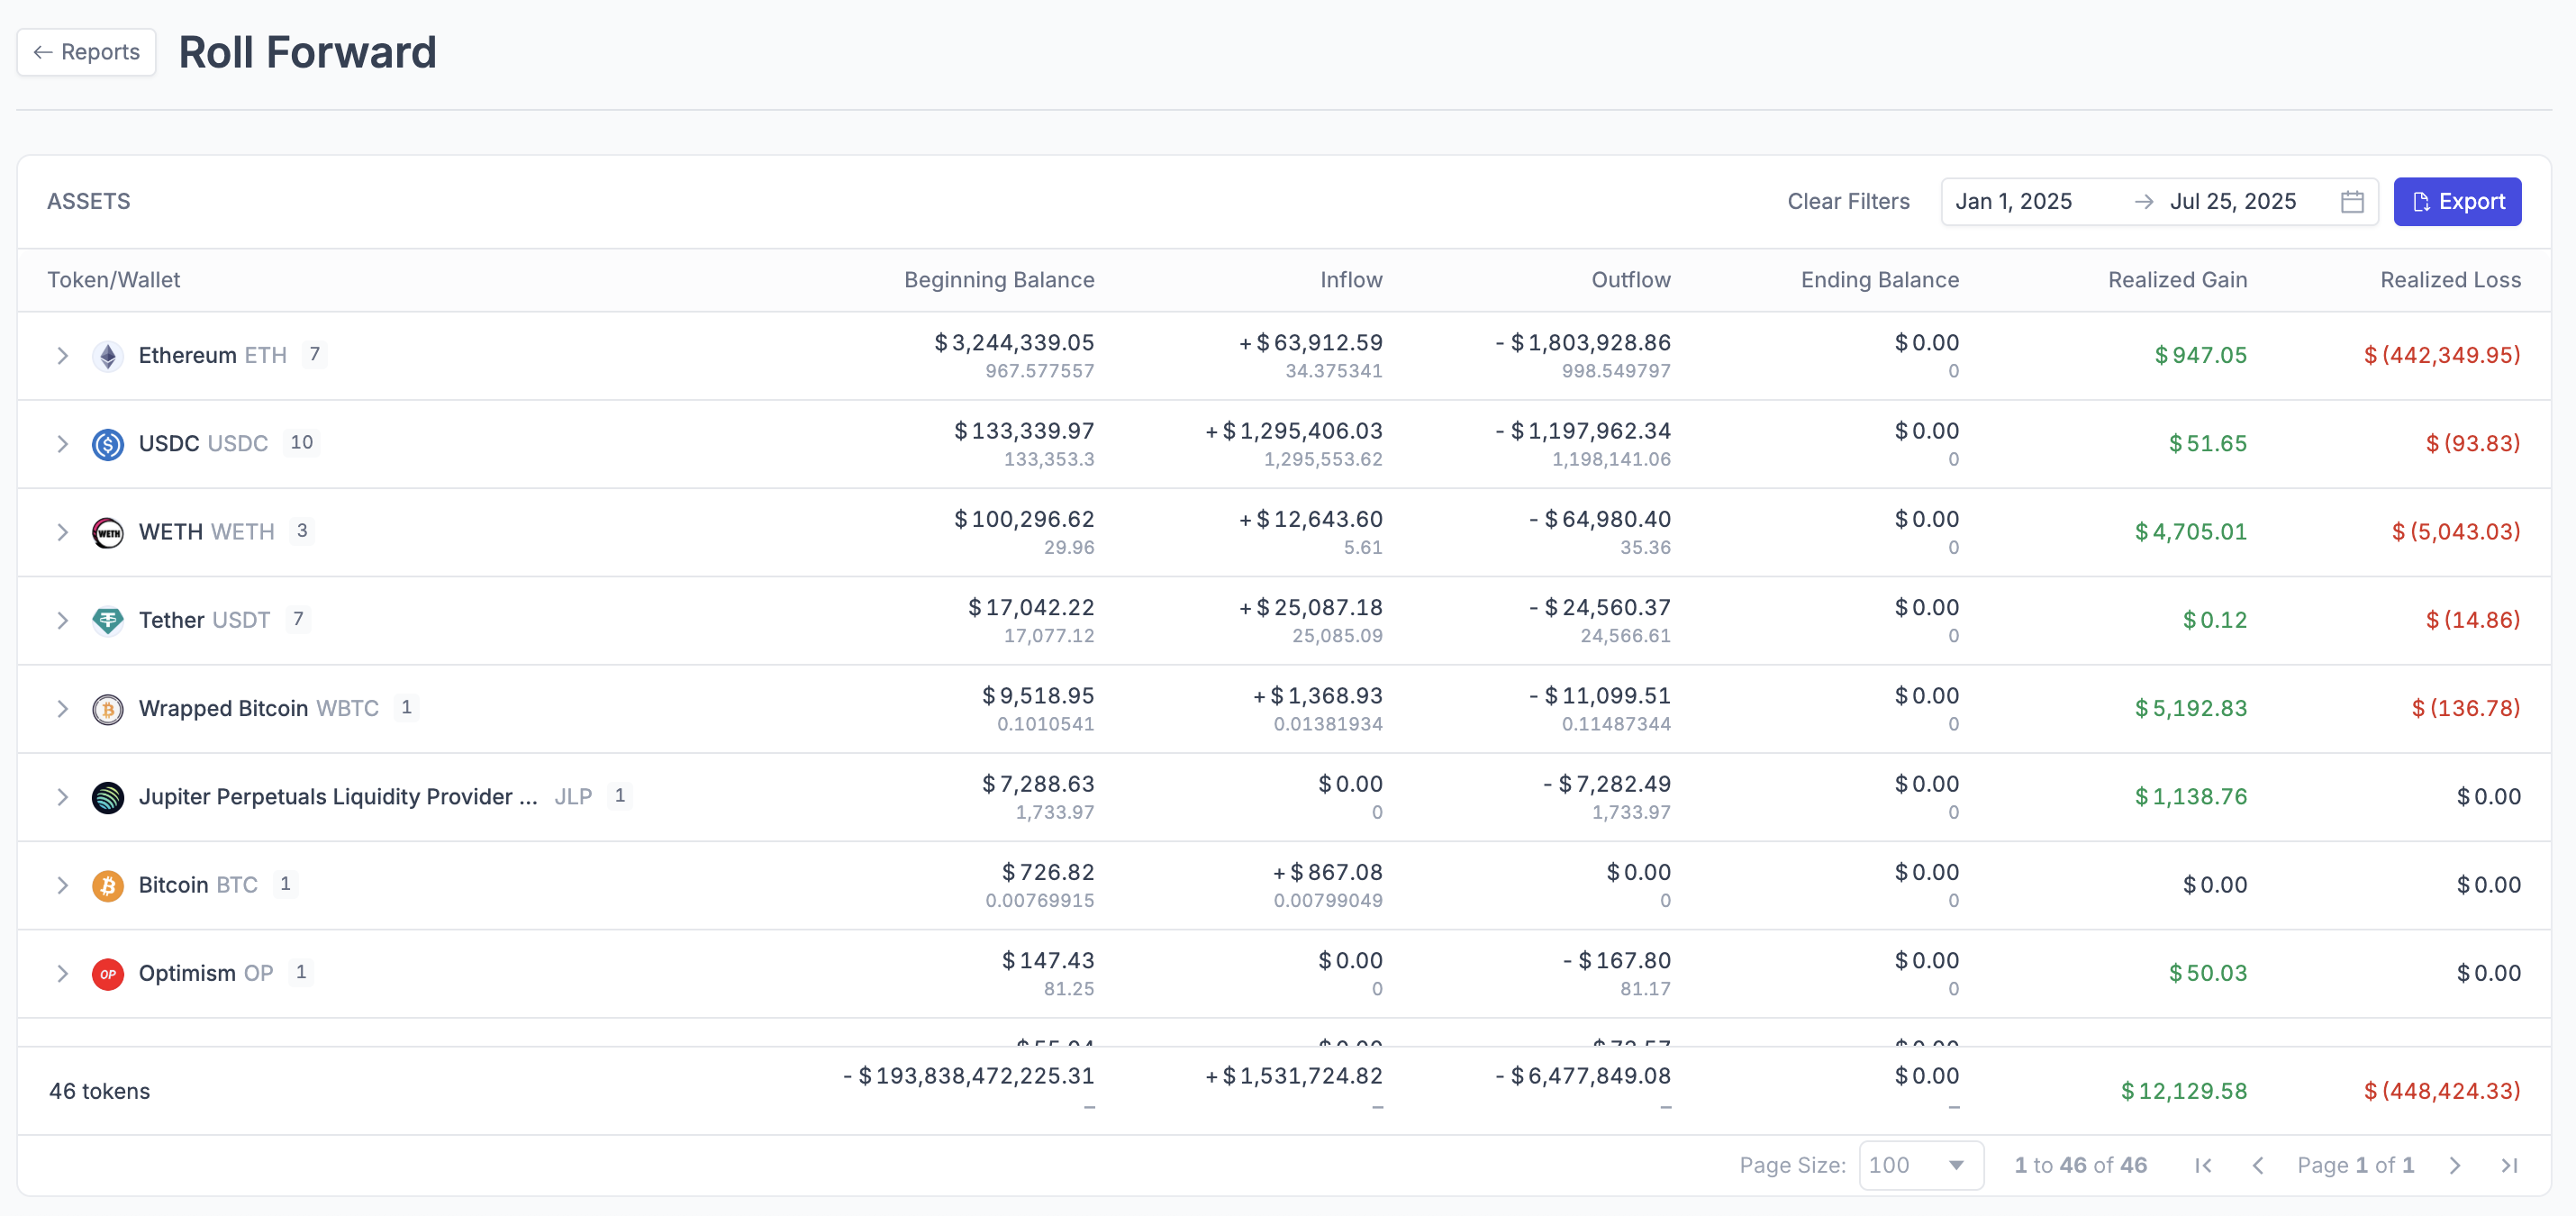
Roll Forward Report
What it shows: Asset movements showing beginning balances, inflows, outflows, and ending balances with realized gains/losses, designed for FASB compliance.
Key information included:
Beginning/Ending Balances - Quantities and fair market values
Inflows/Outflows - Detailed activity during the period
Realized Gains/Losses - Separated into gains and losses
Fair Market Value Changes - Valuation movements over time
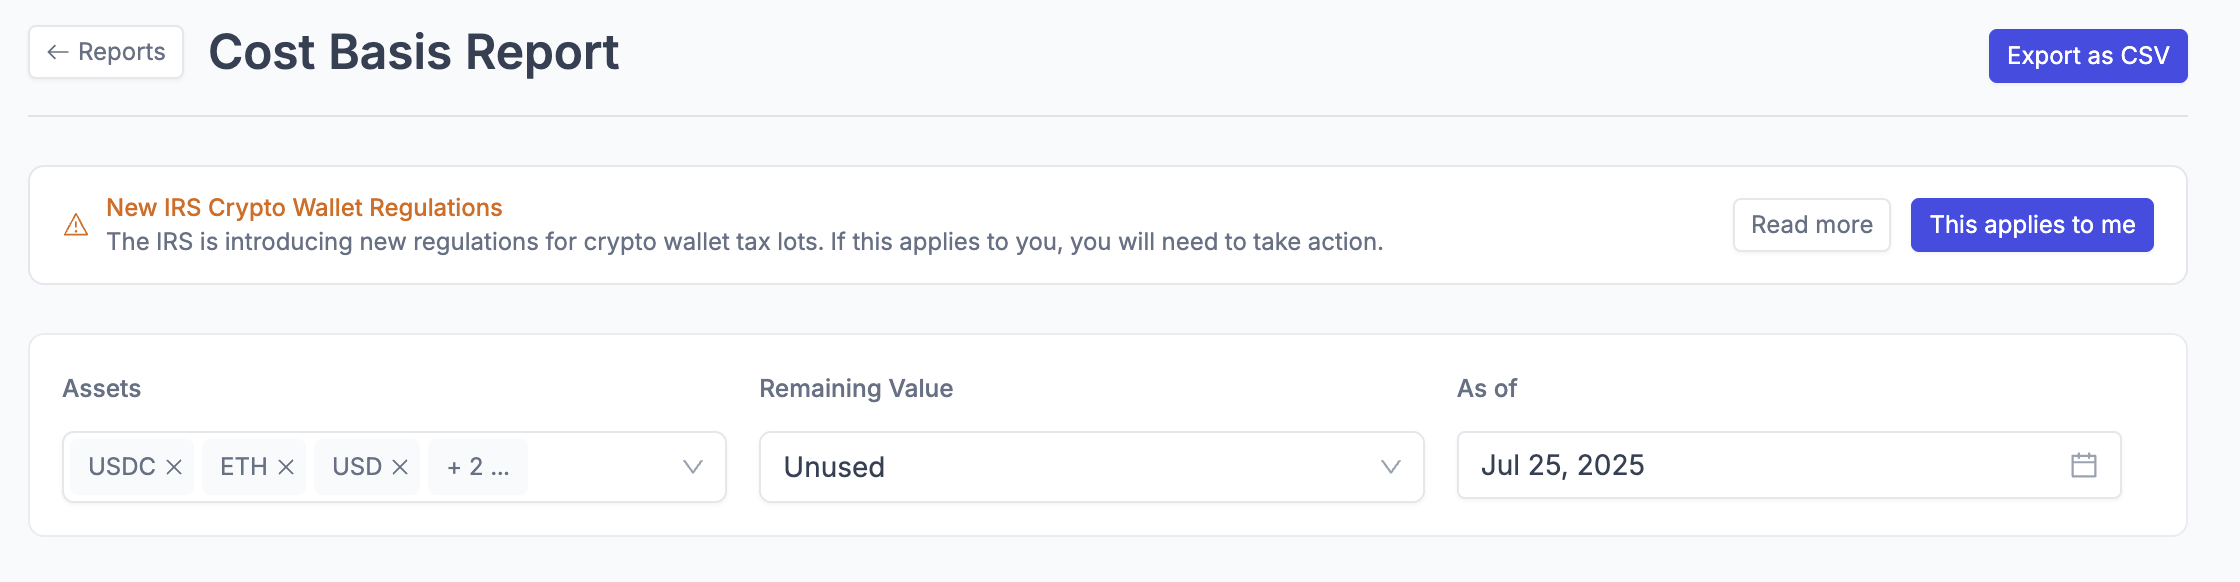
Cost Basis Report
What it shows: Detailed tax lot information showing cost basis tracking using FIFO or ACB (Average Cost Basis) methods.
Key information included:
Lot ID - Unique identifier for each tax lot
Deposit Timestamp - When assets were acquired
Volume Acquired/Sold/Remaining - Quantity tracking
Acquired Price - Original cost per unit
Cost Basis Information - Original and remaining cost basis
Transaction Details - Blockchain transaction data
Safe Harbor Status (if applicable) - Special tax treatment classifications for wallet-level cost basis tracking
Data Export Reports
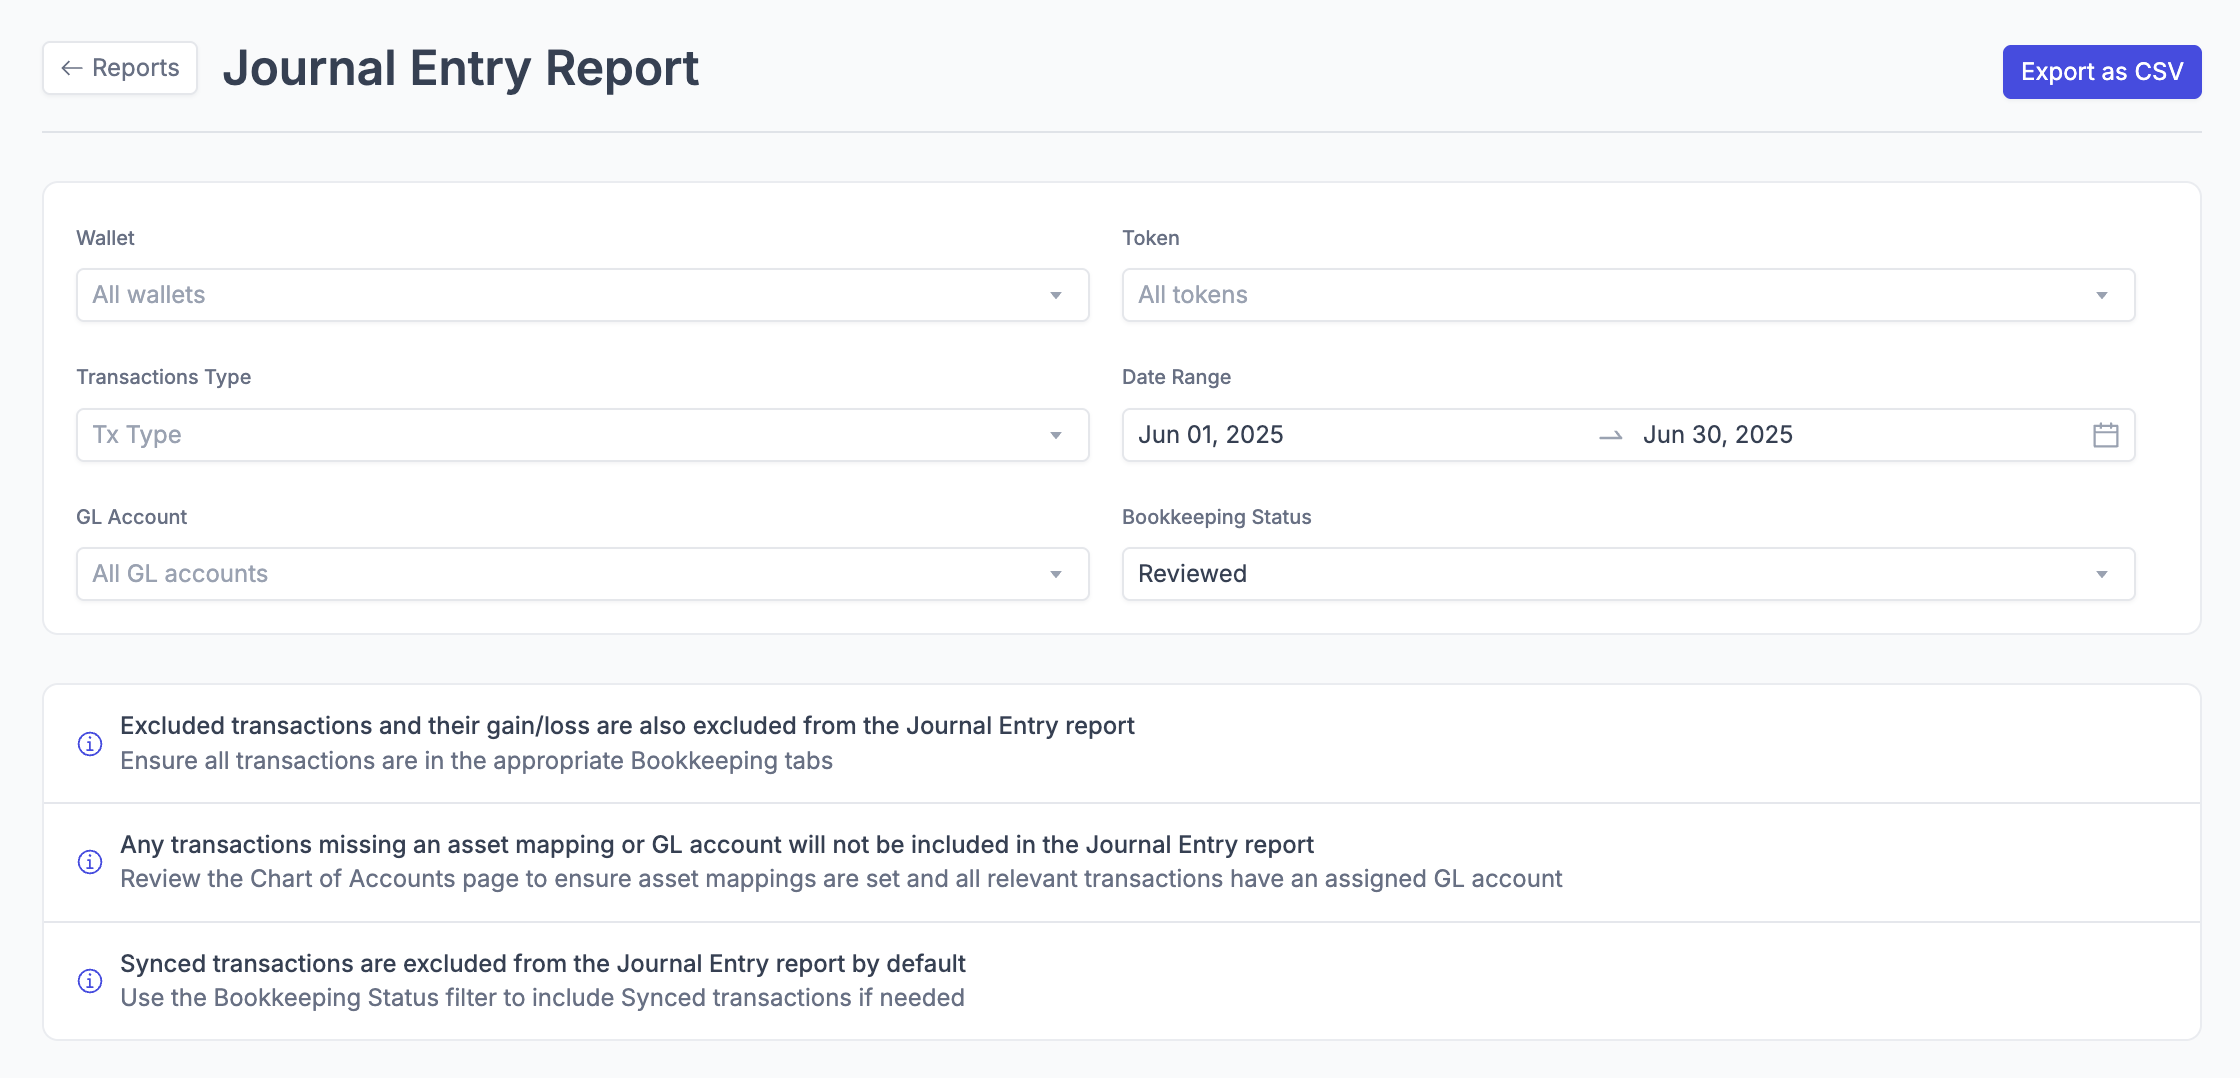
Journal Entry Report
What it shows: General ledger entries formatted for import into ERP systems and accounting software.
Key information included:
Journal Numbers - Sequential entry identifiers
Transaction Dates - When entries were recorded
Account Information - Chart of accounts references
Debit/Credit Amounts - Accounting entry details
Descriptions - Transaction memos and details
When to use it:
Unlike the Journal Entries that are automatically generated when you use Integral's direct Syncing features, this report is generated independently and is not based on data that's already been synced to your ERP.
It's particularly useful for validating information before using our sync features, or if you prefer to manually post journal entries from Integral instead. If you have any questions on how to maximize the use of this report, please reach out to help@integral.xyz
Key notes:
Excluded transactions and their gain/loss are also excluded from the Journal Entry report
Any transactions missing an asset mapping or GL account will not be included in the Journal Entry report
Synced transactions are excluded from the Journal Entry report by default
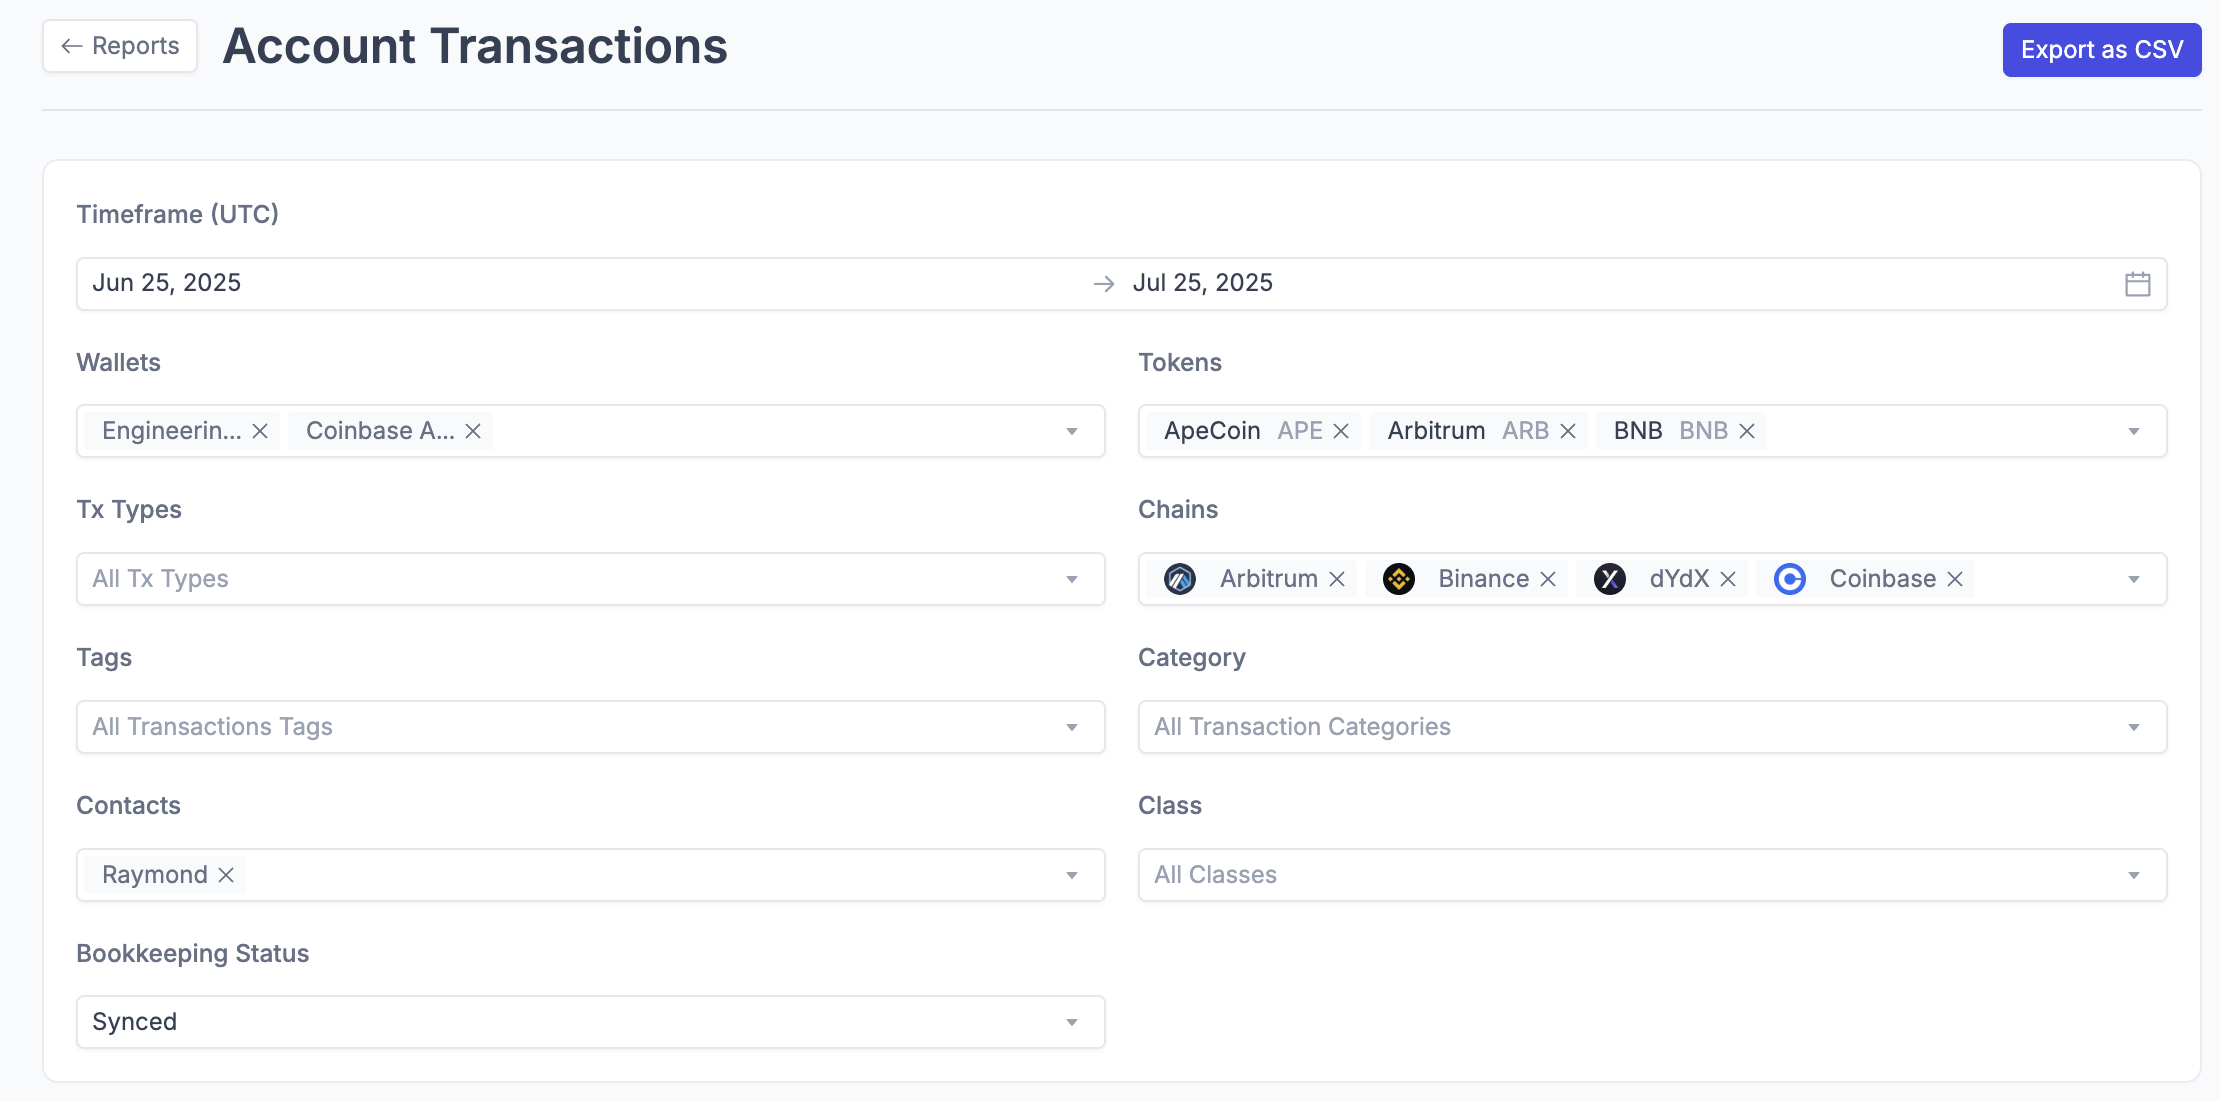
Account Transactions (General ledger)
What it shows: Detailed transaction history with all activity and associated metadata.
Key information included:
Transaction Details - Amounts, dates, GL Accounts/Classes, memos
Blockchain Information - Transaction hashes
Account Information - Source and destination wallets
Asset Details - Tokens and amounts involved
Fee Information - Transaction costs and gas fees
Wallet and Token Balance report
What it shows: A consolidated view of all wallet and token balances across your connected accounts, allowing you to quickly identify any discrepancies and ensure accurate reconciliation.
Key information included:
Name: Identification of each token or wallet being tracked
Reference Balance: External balance queried directly from on-chain
Integral Balance: Balance as tracked within the Integral platform
Match Status: Indicator showing whether balances between sources are consistent or if there are mismatches
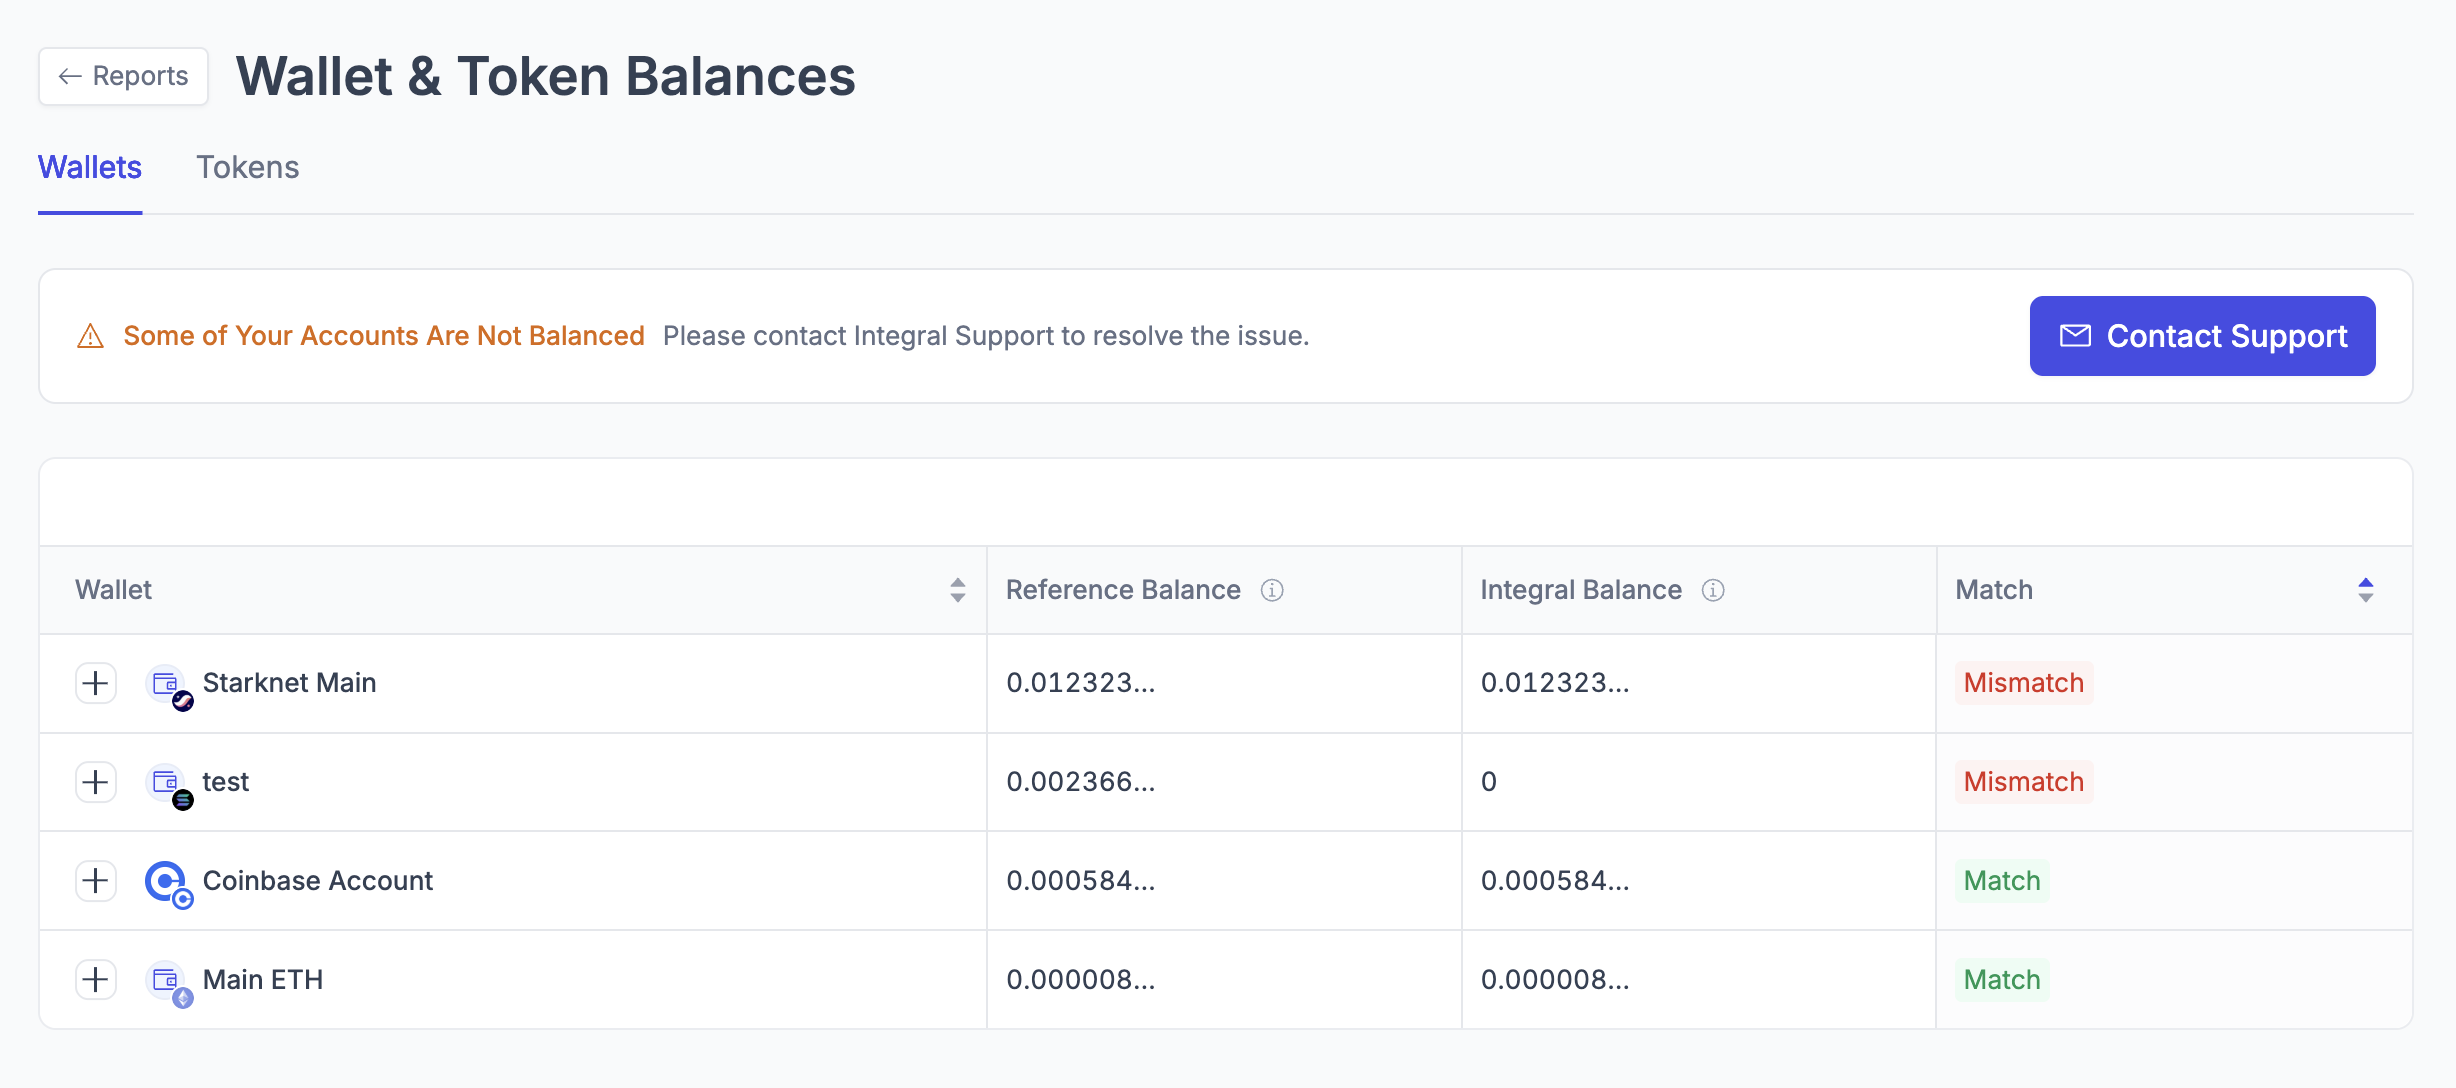
How to fix any mismatches
In most cases, a mismatch for a token or wallet is present simply because the latest sync of new transactions hasn’t started or completed yet. Since we query the reference balance in real time (balance only, not transactions) and sync new transactions every 8 hours, please allow these workflows to finish.
If a sync of new transactions has just completed and there is still a mismatch, reach out to your point of contact at Integral or email help@integral.xyz for assistance.
Click [Expand] to see the variances if viewing the report by Wallet